Showing 3 Result(s)

Infographics

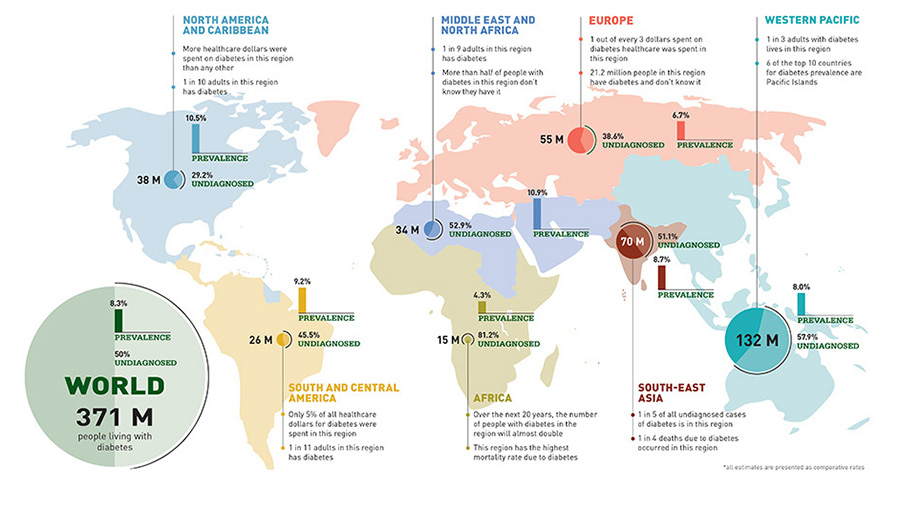
Various data presentations in a graphic form such as schemas, charts, tables, timelines. IDF Atlas poster update Poster with data visualization of diabetes prevalence around the world. 2012 data update of  “IDF Atlas 2011”, a biennial publication about diabetes and its statistics. __ Infographics, graphic design __ Client: International Diabetes Foundation @ De Visu Digital …

365 days in South America

Timeline presenting 365 days of my sabbatical year volunteering and travelling in South America. Travelled surface, weather conditions, visited places, professional, cultural and other activities reconstructed day by day. Illustrated with drawings created during the journey. 220 x 220 mm / 5,5m long accordion book folded in 26 pages / stitches __ Concept, illustration, graphic …

1h_Mateja Artac

1h

Subjective map of a blind trajectory travelled without the benefit of eye sight in Brussels, Sunday 26 April 2009. 307 x 230 mm / 3m long accordion book folded in 13 pages / Braille / case __ Concept, layout and realization __ Personal project